
The Psychology of "Bag Holding" as Visually Represented on Price Charts
The term "bag holder" is a common, often derisive, term in the financial world. It refers to an investor who holds onto a stock or other asset as its price declines, ultimately being left with a losing position – the "bag." But beyond the simple definition, there's a fascinating psychology at play that contributes to this phenomenon, and it's often clearly visible when examining price charts.
Understanding the Psychological Factors
Several cognitive biases and emotional responses can lead an investor to become a bag holder:
- Loss Aversion: This is the tendency to feel the pain of a loss more strongly than the pleasure of an equivalent gain. Investors might hold onto a losing stock hoping it will recover, avoiding the realization of the loss.
- Anchoring Bias: Investors can become anchored to the initial purchase price of a stock. This makes it difficult to sell at a loss, as they are mentally fixated on getting back to their original entry point.
- Confirmation Bias: This involves seeking out information that confirms existing beliefs. An investor might selectively focus on positive news about a declining stock, ignoring warning signs.
- Hope and Optimism: While generally positive traits, excessive hope and optimism can be detrimental in investing. Investors may irrationally believe a stock will rebound, even in the face of strong evidence to the contrary.
- Fear of Missing Out (FOMO): Ironically, FOMO can contribute to bag holding. Investors who bought a stock at its peak due to FOMO may be even more reluctant to sell at a loss, hoping to recoup their initial investment.
Visual Representations on Price Charts
Price charts offer a visual history of a stock's price movements. Certain patterns can provide clues about the psychology of bag holding:
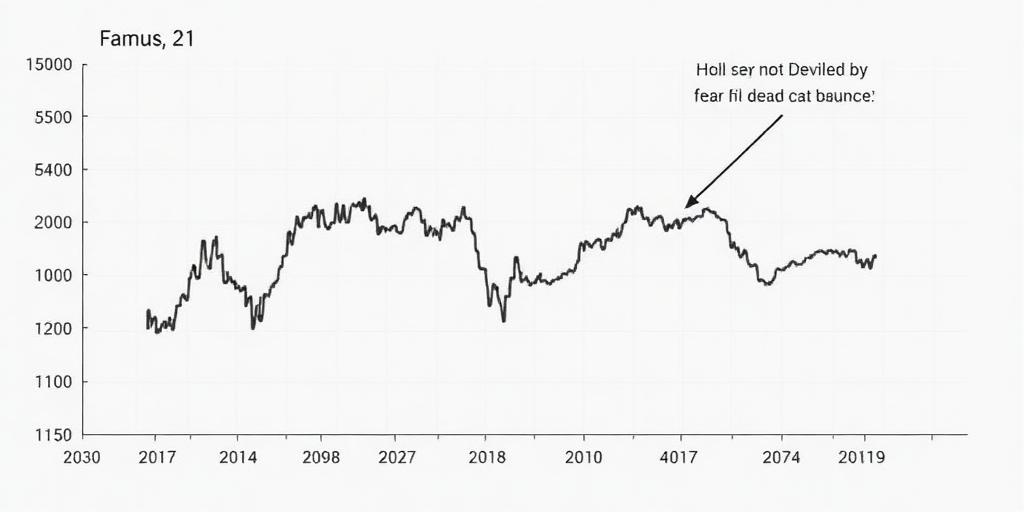
- The "Dead Cat Bounce": This pattern involves a sharp, brief recovery in a stock's price after a significant decline. Bag holders may see this as a sign of a true reversal and hold on, only to be disappointed when the price resumes its downward trend.
- Consolidation at Lower Levels: After a steep decline, a stock might trade sideways for an extended period. This can represent bag holders who are unwilling to sell at the current price, creating resistance to further declines. However, it also prevents new buyers from entering, hindering any potential recovery.
- High Volume on Downward Moves: Increased trading volume during price declines can indicate panic selling. However, it can also represent bag holders finally capitulating and selling their shares, adding further downward pressure.
- Resistance Levels: Areas on a price chart where the price struggles to move above a certain level can indicate the presence of bag holders eager to sell as the price approaches their breakeven point.
Strategies to Avoid Becoming a Bag Holder
While it's impossible to predict the future with certainty, investors can take steps to minimize the risk of becoming a bag holder:
- Set Stop-Loss Orders: A stop-loss order automatically sells a stock when it reaches a predetermined price, limiting potential losses.
- Diversify Your Portfolio: Spreading investments across different asset classes can reduce the impact of any single losing position.
- Conduct Thorough Research: Before investing in a stock, understand the company's fundamentals, its industry, and the overall market conditions.
- Manage Your Emotions: Avoid making impulsive decisions based on fear or greed. Stick to a well-defined investment plan.
- Be Realistic: Not every investment will be a winner. Accept losses as a part of the process and learn from your mistakes.
Conclusion
The psychology of bag holding is a powerful force in the market. By understanding the cognitive biases and emotional factors that contribute to this phenomenon, and by recognizing the visual cues on price charts, investors can make more informed decisions and avoid getting stuck holding the bag. Remember that disciplined risk management and a rational approach are key to long-term investing success.
Long-tail keywords incorporated:
- Psychology of stock market losses
- Avoiding bag holding in investments
- Price chart patterns and investor behavior
- Cognitive biases in trading
- Strategies for managing investment risk


