
The Hidden Psychology of Support and Resistance Levels on Price Charts
Support and resistance levels are fundamental concepts in technical analysis, representing key price points where the market has historically shown a tendency to reverse direction. While these levels are often viewed from a purely technical perspective, a deeper understanding reveals the significant role of psychology in their formation and influence.
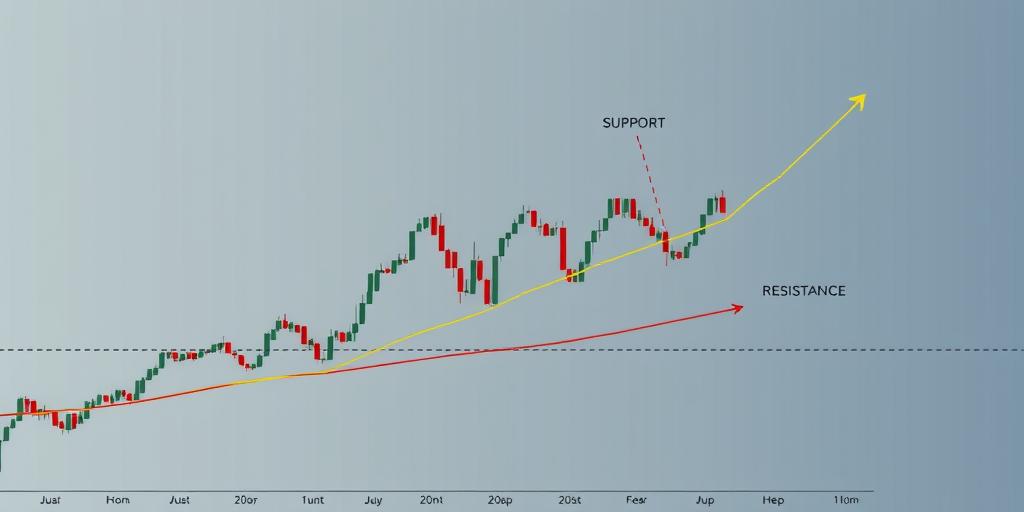
Understanding Support and Resistance
- Support Levels: These are price levels where a downtrend is expected to pause due to a concentration of buyers. As the price decreases towards the support level, buyers are more inclined to purchase, preventing further decline.
- Resistance Levels: Conversely, these are price levels where an uptrend is expected to pause due to a concentration of sellers. As the price increases towards the resistance level, sellers are more inclined to sell, limiting further ascent.
The Psychological Factors at Play
Memory and Anchoring: Traders often remember past price movements and use them as reference points. These historical highs and lows act as psychological anchors, influencing future trading decisions. For example, if a stock has repeatedly failed to break through a certain resistance level, traders may anticipate a similar outcome and initiate sell orders as the price approaches that level again.
Fear of Missing Out (FOMO) and Regret: When a price breaks through a resistance level, it can trigger FOMO among traders who were previously hesitant to buy. This surge in demand can fuel further price increases. Conversely, if a price breaks below a support level, it can induce regret among those who held on, leading to panic selling and accelerated declines.
Self-Fulfilling Prophecy: The widespread belief in support and resistance levels can lead to self-fulfilling prophecies. If a large number of traders believe that a particular level will act as resistance, their collective actions (selling as the price approaches that level) can indeed cause the price to stall or reverse, validating their initial belief.
Herd Mentality: Traders are often influenced by the actions of others. If they see a significant number of traders buying at a support level or selling at a resistance level, they may follow suit, reinforcing the significance of these levels.
Emotional Reactions to Profit and Loss: Support and resistance levels can trigger emotional responses related to profit and loss. For example, a trader who bought a stock near a support level may feel a sense of relief and satisfaction as the price rises, while a trader who shorted a stock near a resistance level may experience anxiety and fear as the price continues to climb.
How to Incorporate Psychology into Your Trading Strategy
- Acknowledge the Influence of Psychology: Be aware that market movements are not solely driven by rational analysis but also by the collective emotions and biases of traders.
- Identify Key Psychological Levels: Look for support and resistance levels that have been tested multiple times, as these are more likely to be significant in the eyes of other traders.
- Observe Price Action Around These Levels: Pay attention to how the price behaves as it approaches these levels. Are there signs of increased buying or selling pressure? Are there any candlestick patterns that suggest a potential reversal?
- Consider Using Sentiment Indicators: Sentiment indicators, such as the put/call ratio or the VIX, can provide insights into the overall market sentiment and help you gauge the likelihood of a breakout or breakdown.
By understanding the hidden psychology behind support and resistance levels, traders can gain a more nuanced perspective on market behavior and improve their trading decisions.


