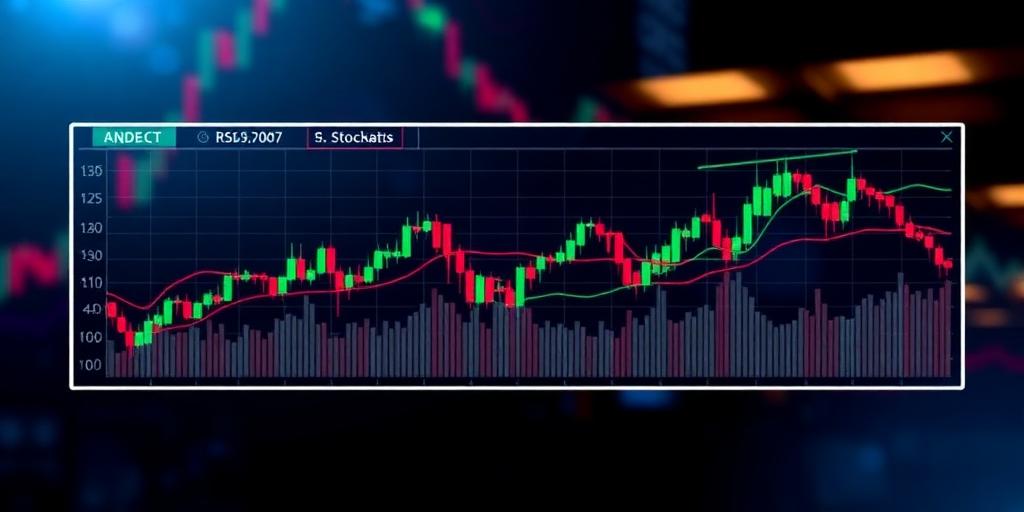
Understanding RSI and Stochastics: Gauging Overbought/Oversold Market Emotions
In the world of technical analysis, traders and investors employ various indicators to decipher market sentiment and potential price movements. Among these, the Relative Strength Index (RSI) and Stochastics are popular tools for identifying overbought and oversold conditions. This article delves into these indicators, explaining their mechanics and how they can be used to inform trading decisions.
What is the Relative Strength Index (RSI)?
The Relative Strength Index (RSI) is a momentum oscillator that measures the speed and change of price movements. Developed by J. Welles Wilder, it oscillates between 0 and 100. Traditionally, RSI is considered overbought when above 70 and oversold when below 30. These levels can indicate potential trend reversals or corrections.
Key Components of RSI:
- Calculation: The RSI is calculated using the average price gains and losses over a specified period, typically 14 days. The formula is: RSI = 100 – [100 / (1 + (Average Gain / Average Loss))].
- Interpretation:
- Overbought: Readings above 70 suggest that the asset may be overvalued and due for a price decrease.
- Oversold: Readings below 30 indicate that the asset may be undervalued and poised for a price increase.
- Divergence: RSI divergence occurs when the price of an asset is making new highs (or lows), while the RSI is failing to confirm those highs (or lows). This can signal a potential trend reversal.
- Centerline Crossover: Some traders also use the 50 level as a centerline. A move above 50 suggests bullish momentum, while a move below suggests bearish momentum.
What are Stochastics?
Stochastics, or the Stochastic Oscillator, is another momentum indicator comparing an asset's closing price to its price range over a specific period. Developed by George Lane, it consists of two lines: %K and %D, oscillating between 0 and 100.
Key Components of Stochastics:
- Calculation:
- %K: Represents the current price relative to the high/low range over a period. The formula is: %K = (Current Close - Lowest Low) / (Highest High - Lowest Low) * 100.
- %D: A 3-period simple moving average of %K. It acts as a signal line.
- Interpretation:
- Overbought: Typically, readings above 80 are considered overbought.
- Oversold: Readings below 20 are considered oversold.
- Crossovers: The crossover of the %K and %D lines is a key signal. A bullish signal occurs when %K crosses above %D, and a bearish signal when %K crosses below %D. These crossovers, when occurring in overbought or oversold regions, are considered stronger signals.
- Divergence: Similar to RSI, divergence between the price and the Stochastic Oscillator can indicate potential reversals.
How to Use RSI and Stochastics Together
While both RSI and Stochastics are momentum indicators, they provide unique signals and can be used together to improve the reliability of trading decisions.
Combining the Signals:
- Confirmation: Look for confluence between the two indicators. For example, if RSI is nearing overbought levels while Stochastics also shows a potential bearish crossover, it strengthens the case for a possible downward move.
- Filtering: Use one indicator to filter the signals of the other. For instance, take only Stochastic crossover signals that are confirmed by the RSI being in the overbought or oversold territory.
- Divergence: Watch for RSI and Stochastic divergence patterns aligning. If both indicators show bearish divergence while the price is making new highs, it can be a strong indication of an impending reversal.
Practical Examples
Example 1: Identifying a Potential Short Position
- Scenario: A stock has been trending upwards, and the RSI reaches 75, indicating overbought conditions. Simultaneously, the Stochastic Oscillator shows a bearish crossover with %K crossing below %D above the 80 level.
- Action: Consider opening a short position, anticipating a price correction.
Example 2: Identifying a Potential Long Position
- Scenario: A cryptocurrency has been declining, and the RSI drops to 25, signaling oversold conditions. Concurrently, the Stochastic Oscillator indicates a bullish crossover with %K crossing above %D below the 20 level.
- Action: Evaluate initiating a long position, expecting a price rebound.
Limitations and Considerations
- Whipsaws: RSI and Stochastics can produce false signals, especially in volatile markets. Prices can quickly reverse, leading to losing trades if the signals are followed blindly.
- Parameter Settings: The default settings (e.g., 14-period for RSI, 14-period %K for Stochastics) may not be optimal for all assets or timeframes. Experiment to find the settings that work best for your trading strategy.
- Market Context: Always consider the broader market context, including trend direction, support and resistance levels, and news events, before making trading decisions based on RSI and Stochastic signals.
Conclusion
RSI and Stochastics are valuable tools for identifying potential overbought and oversold conditions in the market. By understanding their mechanics and combining their signals, traders can enhance their ability to make informed decisions. However, it's crucial to acknowledge their limitations and use them in conjunction with other forms of analysis and risk management techniques to achieve consistent results in trading.


