
Decoding the VIX: A Visual Guide to Investor Fear
The VIX, or Volatility Index, often referred to as the "fear gauge," is a real-time index representing the market’s expectation of 30-day forward-looking volatility. It is derived from the price of S&P 500 index options, providing a window into investor sentiment and anxiety levels. Spikes in the VIX graphically illustrate moments of collective investor unease, typically correlating with market downturns or periods of economic uncertainty. Let's explore how to interpret these spikes and what they signify.
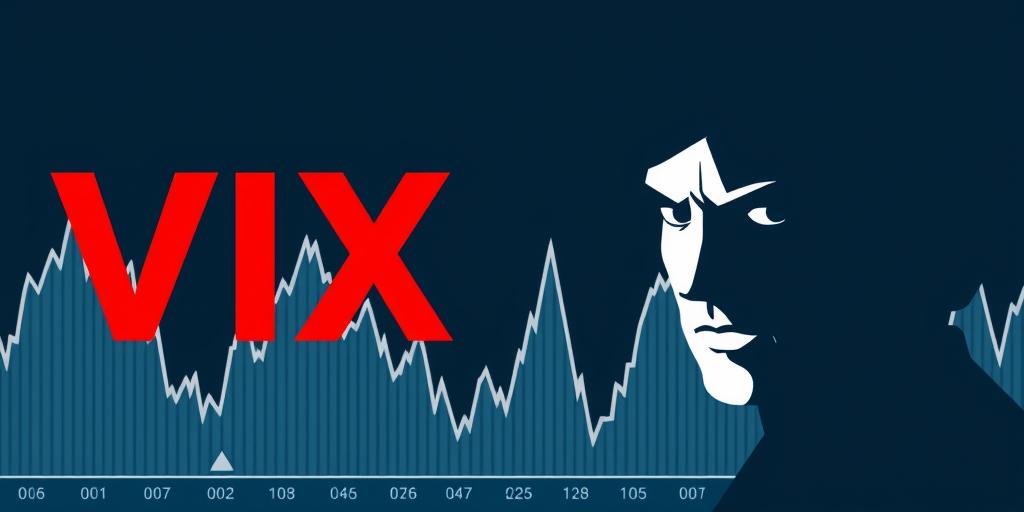
Understanding the VIX Graph
The VIX is presented as a line graph, with the x-axis representing time and the y-axis indicating the index value. A rising VIX indicates increasing market volatility and investor fear, while a declining VIX suggests decreasing volatility and greater market complacency. Here’s what to look for:
- Baseline Level: Historically, the VIX averages around 15-20. Values below this range suggest a period of relative market calm.
- Spikes: Significant increases above 30 are often interpreted as heightened fear and potential market correction. Values above 40 indicate extreme fear.
- Duration: The length of time the VIX remains elevated is crucial. A brief spike might indicate a short-term reaction, while a sustained high level suggests deeper concerns.
Key Indicators of VIX Spikes
- Market Corrections: VIX spikes frequently accompany market corrections. As stock prices decline, investors rush to buy options to hedge their portfolios, driving up option prices and, consequently, the VIX.
- Economic News: Major economic announcements, such as GDP reports, inflation data, or employment figures, can trigger VIX spikes if the results deviate significantly from expectations.
- Geopolitical Events: Events like political instability, trade wars, or unexpected international crises can inject uncertainty into the market, leading to increased volatility and a higher VIX.
- Earnings Season: During earnings season, unexpected results from major companies can lead to increased market volatility, particularly if the news impacts overall market sentiment.
Interpreting VIX Behavior
- High VIX: A high VIX often signals a buying opportunity. Contrarian investors see elevated fear levels as a sign that the market may be oversold and poised for a rebound.
- Low VIX: A low VIX can be a warning sign of complacency. When investors become too comfortable, they may underestimate risks, setting the stage for a potential correction.
Using the VIX in Investment Strategies
The VIX can be a valuable tool for managing risk and making informed investment decisions:
- Hedging: Investors use VIX-related products to hedge their portfolios against market downturns. VIX futures and options can increase in value when the market declines, offsetting losses.
- Volatility Trading: Sophisticated traders use the VIX to speculate on market volatility. Strategies involve buying or selling VIX futures and options based on their expectations of future volatility.
- Risk Assessment: Monitoring the VIX can help investors gauge the overall risk level in the market and adjust their portfolio allocations accordingly.
Conclusion
The VIX serves as a graphical representation of collective investor anxiety, offering insights into market sentiment and potential turning points. By understanding how to interpret VIX spikes and their underlying causes, investors can make more informed decisions, manage risk effectively, and potentially capitalize on market volatility. Keeping a close eye on the VIX is essential for navigating the complexities of the financial markets and staying one step ahead of potential crises.


