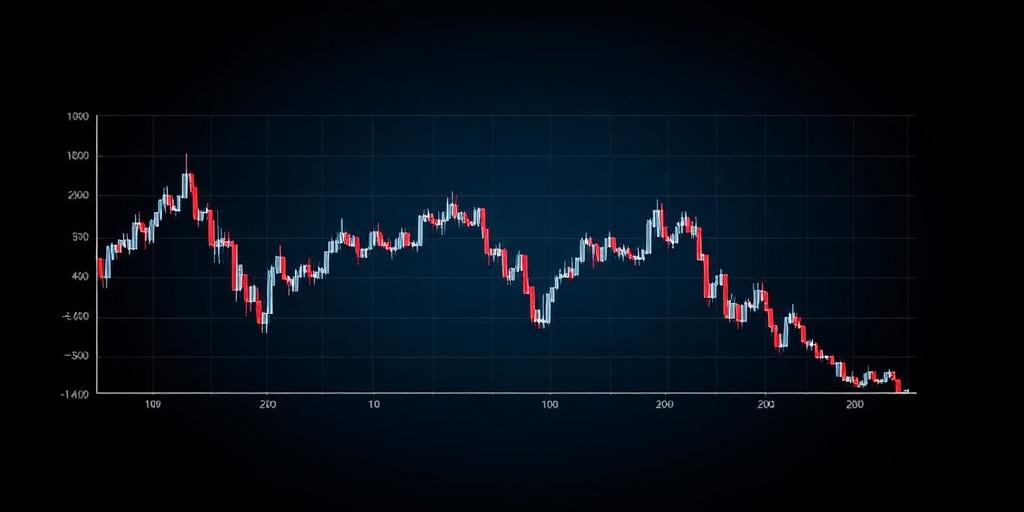
The "Dead Cat Bounce": A Chart Pattern of Hope, Denial, and Market Reality
In the world of financial markets, patterns emerge that can offer insights into potential future price movements. One such pattern, known as the "dead cat bounce," is a phenomenon that traders and investors should be aware of. It's a deceptive rally that occurs within a larger downtrend, luring in hopeful buyers before the price resumes its downward trajectory. This article will delve into the intricacies of the dead cat bounce, helping you understand its characteristics, how to identify it, and strategies for navigating it.
What is a Dead Cat Bounce?
The term "dead cat bounce" is a colorful analogy. It suggests that even a dead cat will bounce if dropped from a sufficient height. In financial terms, it refers to a temporary recovery in the price of a stock or asset after a significant decline. This bounce gives the false impression that the downtrend is over, enticing investors to buy in, only for the price to fall further afterward. It's a cruel trick played by the market, preying on optimism and a desire to catch a falling knife.
Characteristics of a Dead Cat Bounce
Identifying a dead cat bounce isn't always easy, as it can resemble a genuine trend reversal. However, there are several characteristics to look for:
- Sharp Downtrend Preceding the Bounce: A dead cat bounce typically follows a substantial and rapid decline in price. This sets the stage for a potential relief rally.
- Weak Volume During the Bounce: The volume of trading during the bounce is often lower than during the preceding downtrend. This indicates a lack of strong conviction among buyers.
- Short Duration: The bounce is usually short-lived, lasting from a few days to a couple of weeks. It doesn't have the staying power of a true trend reversal.
- Failure to Break Resistance: The price often fails to break through key resistance levels during the bounce, indicating underlying selling pressure.
- Resumption of Downtrend: After the bounce, the price resumes its downward trajectory, often falling to new lows.
How to Identify a Dead Cat Bounce
While no method is foolproof, here are some techniques to help you identify a potential dead cat bounce:
- Technical Indicators: Use indicators like the Relative Strength Index (RSI) and Moving Average Convergence Divergence (MACD) to gauge the strength of the bounce. Overbought conditions and bearish divergences can be warning signs.
- Volume Analysis: Compare the volume during the bounce to the volume during the preceding downtrend. Lower volume suggests less conviction among buyers.
- Trendlines and Support/Resistance Levels: Draw trendlines and identify key support and resistance levels. A failure to break resistance levels can indicate a dead cat bounce.
- Chart Patterns: Look for bearish chart patterns, such as head and shoulders or descending triangles, that may form after the bounce.
- News and Fundamentals: Consider the underlying fundamentals of the asset. Are there any positive catalysts that could justify a genuine reversal? If not, the bounce is more likely to be a dead cat bounce.
Strategies for Navigating a Dead Cat Bounce
Navigating a dead cat bounce requires caution and discipline. Here are some strategies to consider:
- Avoid Catching the Falling Knife: Resist the urge to buy into the bounce, especially if you missed the initial downtrend. It's often better to wait for confirmation of a trend reversal before entering a long position.
- Tighten Stop-Loss Orders: If you're already in a long position, tighten your stop-loss orders to protect your capital in case the downtrend resumes.
- Consider Shorting Opportunities: Experienced traders may consider shorting the bounce, betting on the resumption of the downtrend. However, this is a high-risk strategy that requires careful risk management.
- Focus on Long-Term Investments: If you're a long-term investor, don't let a dead cat bounce shake you out of your positions. Focus on the underlying fundamentals of your investments and ride out the volatility.
- Patience is Key: Sometimes, the best strategy is to simply wait and observe. Let the market reveal its intentions before making any rash decisions.
Conclusion
The dead cat bounce is a common yet deceptive pattern in financial markets. By understanding its characteristics and using appropriate analytical tools, traders and investors can improve their ability to identify it and avoid its pitfalls. Remember that caution, discipline, and a focus on long-term fundamentals are essential when navigating these tricky market conditions. Don't let a temporary bounce lure you into a losing position.


