
Candlestick patterns are a visual representation of price movements in financial markets. Originating in Japan, these patterns provide insights into market sentiment and potential future price action. Each candlestick represents a specific time frame and encapsulates four key data points: the open, close, high, and low prices.
Anatomy of a Candlestick
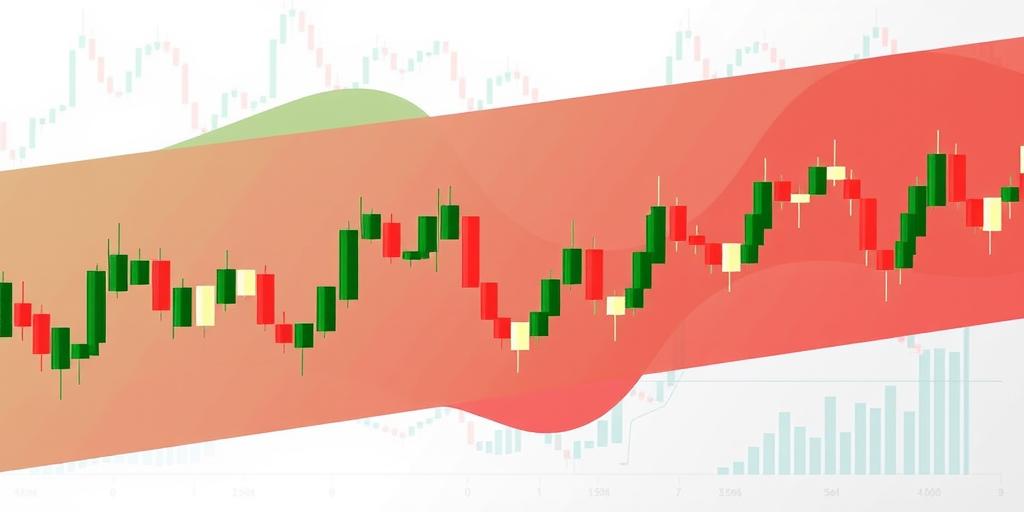
A candlestick consists of two main parts: the body and the wicks (or shadows). The body represents the range between the opening and closing prices. If the closing price is higher than the opening price, the body is typically colored green or white, indicating a bullish (positive) movement. Conversely, if the closing price is lower than the opening price, the body is colored red or black, indicating a bearish (negative) movement. The wicks extend from the top and bottom of the body, representing the high and low prices reached during that time frame.
Common Candlestick Patterns and Their Emotional Stories
1. Bullish Engulfing
The bullish engulfing pattern occurs when a small bearish (red) candlestick is followed by a large bullish (green) candlestick that completely engulfs the previous one. This pattern suggests a strong shift in sentiment from bearish to bullish, indicating that buyers have taken control and a potential uptrend may follow. The emotional story here is one of initial fear and selling pressure, quickly overcome by strong buying interest and optimism.
2. Bearish Engulfing
Conversely, the bearish engulfing pattern occurs when a small bullish (green) candlestick is followed by a large bearish (red) candlestick that completely engulfs the previous one. This pattern signals a shift from bullish to bearish sentiment, suggesting that sellers have taken over and a downtrend may be imminent. The emotional narrative is one of initial optimism and buying pressure, replaced by strong selling interest and pessimism.
3. Hammer and Hanging Man
The hammer is a bullish reversal pattern that forms after a downtrend. It has a small body near the top and a long lower wick, indicating that sellers initially pushed the price down, but buyers stepped in to drive the price back up. The hanging man, on the other hand, is a bearish reversal pattern that forms after an uptrend and looks identical to the hammer. However, its significance is different, suggesting that sellers are starting to gain control. Both patterns tell a story of indecision, but the context (uptrend or downtrend) determines the likely outcome.
4. Doji
A doji candlestick occurs when the opening and closing prices are virtually the same. This pattern signifies indecision in the market, with neither buyers nor sellers able to gain a clear advantage. Doji patterns can appear in various forms, such as the long-legged doji, dragonfly doji, and gravestone doji, each with slightly different implications. The emotional story is one of equilibrium and uncertainty, often preceding a significant price movement.
5. Morning Star and Evening Star
The morning star is a bullish reversal pattern that consists of three candlesticks: a large bearish candlestick, a small-bodied candlestick (either bullish or bearish), and a large bullish candlestick. It indicates that the downtrend is losing momentum and a potential uptrend is forming. The evening star is the bearish counterpart, consisting of a large bullish candlestick, a small-bodied candlestick, and a large bearish candlestick, signaling a potential downtrend. These patterns tell a story of transition and shifting sentiment, from bearish to bullish (morning star) or bullish to bearish (evening star).
Interpreting Candlestick Patterns
It's important to note that candlestick patterns should not be viewed in isolation. They are most effective when used in conjunction with other technical indicators and analysis techniques. Volume, trendlines, and support/resistance levels can provide additional confirmation and context for interpreting candlestick patterns. Additionally, the time frame of the candlestick chart can influence the significance of the patterns; longer time frames (e.g., daily or weekly) tend to produce more reliable signals than shorter time frames (e.g., hourly or 5-minute).
Candlestick patterns offer a unique window into the emotional dynamics of the market, reflecting the ongoing battle between buyers and sellers. By understanding the stories these patterns tell, traders and investors can gain a deeper appreciation for market sentiment and improve their decision-making process.


