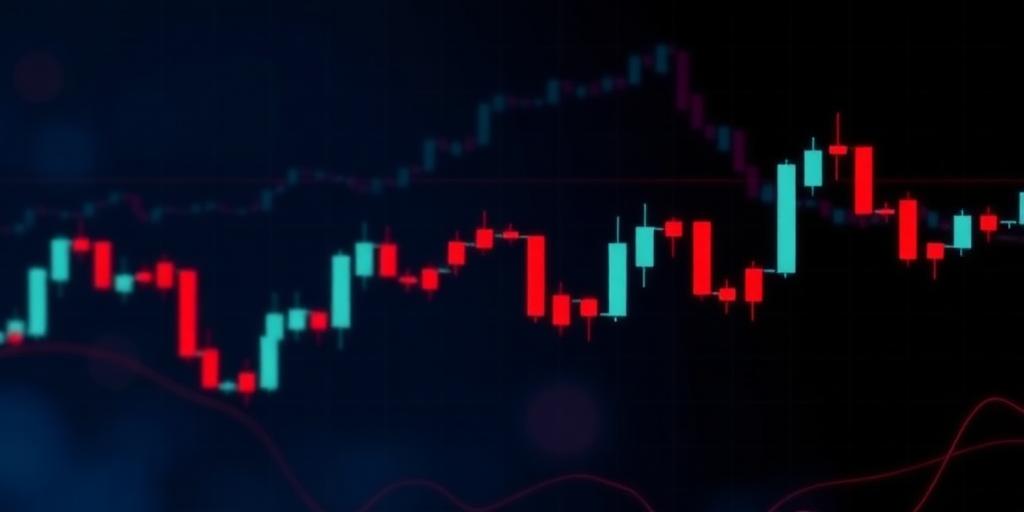
Doji Candlesticks: A Visual Sign of Market Indecision or an Impending Emotional Shift?
In the world of financial markets, candlestick patterns provide valuable insights into price movements and potential trend reversals. Among these patterns, the Doji candlestick stands out as a significant indicator of market indecision or an impending emotional shift. This article delves into the intricacies of Doji candlesticks, exploring their formation, interpretation, and implications for traders and investors.
What is a Doji Candlestick?
A Doji candlestick is a single-day pattern characterized by a small body, indicating that the opening and closing prices are virtually equal. The most important part of the Doji is the small body relative to the wicks on either side of it. This implies that during the trading session, the price moved significantly in both directions but ultimately closed near where it opened. The resulting candlestick resembles a cross, inverted cross, or a plus sign.
Formation of a Doji
The formation of a Doji candlestick reflects a state of equilibrium between buying and selling pressures. The market opens at a certain price level, and buyers and sellers engage in a tug-of-war throughout the trading session. However, neither side gains a decisive advantage, leading to the price closing near the opening level. This indecision signifies a potential turning point in the prevailing trend.
Types of Doji Candlesticks
While all Doji candlesticks share the common characteristic of a small body, variations exist based on the length and position of the upper and lower shadows. These variations provide additional insights into the market dynamics:
Long-Legged Doji: This type of Doji has long upper and lower shadows, indicating significant price volatility during the trading session. It suggests a high degree of uncertainty and potential for a major trend reversal.
Dragonfly Doji: The Dragonfly Doji occurs when the opening and closing prices are at the high of the day. It has a long lower shadow, indicating that buyers stepped in to push the price back up after sellers initially drove it lower. It's a bullish signal, especially in a downtrend.
Gravestone Doji: Conversely, the Gravestone Doji forms when the opening and closing prices are at the low of the day. It features a long upper shadow, suggesting that sellers overpowered buyers after an initial price rally. This is generally seen as a bearish signal, particularly in an uptrend.
Four Price Doji: This Doji has no body or shadows; the open, high, low, and close are the same. This is often found in less liquid markets.
Interpretation and Implications
Doji candlesticks carry significant implications for traders and investors, signaling potential trend reversals or continuations:
- Indecision and Uncertainty: The primary message conveyed by a Doji is indecision in the market. It suggests that the prevailing trend may be losing momentum, and a change in direction could be imminent.
- Confirmation with Other Indicators: Doji candlesticks are most effective when used in conjunction with other technical indicators and chart patterns. Confirmation from additional sources strengthens the validity of the Doji signal.
- Contextual Analysis: The interpretation of a Doji depends on the broader market context. Factors such as the preceding trend, support and resistance levels, and overall market sentiment should be considered.
- Potential Trend Reversal: When a Doji appears after a prolonged uptrend or downtrend, it often signals a potential trend reversal. Traders may look for further confirmation before taking action, such as a break below the low of the Doji for a bearish reversal or a break above the high for a bullish reversal.
- Continuation Signal: In some cases, a Doji may act as a continuation signal, particularly in sideways or consolidating markets. If the price breaks out in the direction of the prior trend after a Doji, it suggests that the trend is likely to resume.
Conclusion
Doji candlesticks serve as valuable tools for understanding market dynamics and anticipating potential price movements. By recognizing the formation and interpreting the implications of Doji patterns, traders and investors can gain a competitive edge in the financial markets. However, it's important to remember that Doji candlesticks should be used in conjunction with other technical analysis techniques to increase the accuracy and reliability of trading decisions.


