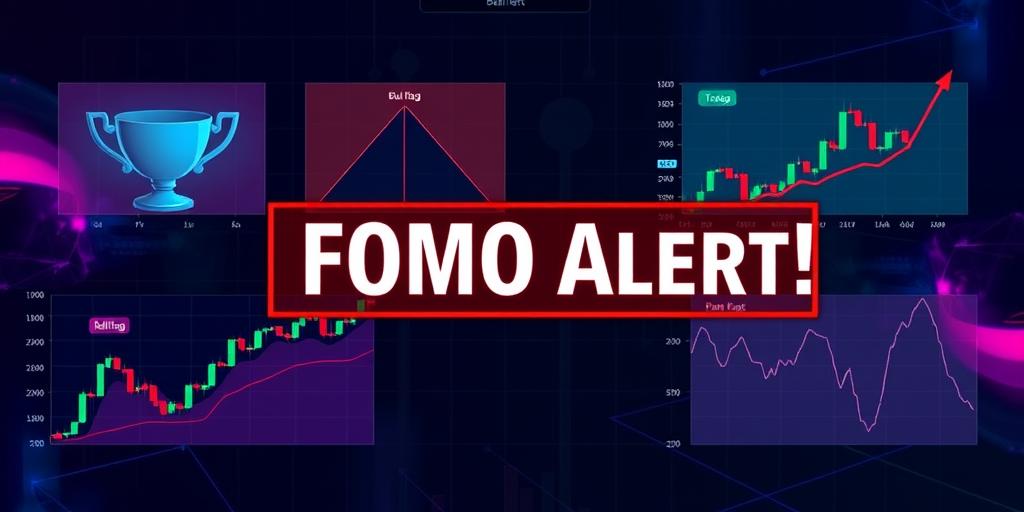
Chart patterns can provide valuable insights into potential market movements, but some formations practically scream "FOMO alert!" to traders. These patterns often indicate strong bullish momentum, leading to a fear of missing out (FOMO) and a rush to buy, which can further amplify the price surge. Recognizing these patterns early can help traders make informed decisions, but it's crucial to remember that no pattern guarantees success, and risk management is always essential.
1. Cup and Handle
The Cup and Handle is a bullish continuation pattern that resembles a cup with a handle. The "cup" is a rounded bottom that forms during a period of price consolidation. The "handle" is a slight downward drift or consolidation near the top of the cup. When the price breaks above the handle's resistance, it signals a potential breakout and a strong buying opportunity. The psychology behind this pattern suggests that initial buying interest is met with some profit-taking, forming the cup. The handle represents a period of renewed accumulation before the price surges higher.
2. Ascending Triangle
An Ascending Triangle is another bullish pattern characterized by a rising price that consolidates against a horizontal resistance level. The upper trendline is flat, indicating consistent selling pressure at that level, while the lower trendline slopes upwards, showing increasing buying pressure. As the price continues to make higher lows, it eventually breaks above the horizontal resistance, triggering a breakout. The FOMO element here arises from traders recognizing the potential for a significant move upwards as soon as the resistance is breached.
3. Bull Flag
The Bull Flag is a short-term continuation pattern that appears after a strong upward move. It looks like a flag or a pennant, with the "pole" representing the initial surge and the "flag" representing a period of consolidation. This consolidation typically slopes downwards, forming a tight range. When the price breaks above the upper trendline of the flag, it suggests that the uptrend is resuming, and traders rush in to capitalize on the continuation. The Bull Flag is particularly potent because it often occurs quickly, intensifying the feeling of missing out if one hesitates.
4. Inverse Head and Shoulders
The Inverse Head and Shoulders pattern is a reversal pattern that occurs at the bottom of a downtrend. It consists of a head (the lowest point), two shoulders (higher lows), and a neckline (resistance level). When the price breaks above the neckline, it signals a reversal of the downtrend and the beginning of a new uptrend. This pattern can trigger FOMO because it indicates a significant shift in market sentiment from bearish to bullish, prompting traders to jump in before the price rises too high.
5. Breakouts from Consolidations
While not a specific pattern, breakouts from extended periods of consolidation can also induce FOMO. When a price has been trading within a tight range for an extended period, it creates pent-up energy. A breakout from this range, especially with high volume, signals a potential trend and can trigger a rush of buyers. The longer the consolidation, the more significant the breakout is likely to be, increasing the fear of missing a substantial move.
Trading Considerations
While these chart patterns can be helpful in identifying potential FOMO situations, it's essential to approach them with caution. Always confirm the pattern with other technical indicators and consider the overall market context. Set stop-loss orders to manage risk and avoid getting caught in false breakouts. Additionally, be wary of chasing prices too aggressively, as this can lead to overextended positions and increased losses.
Recognizing chart patterns that signal potential FOMO can be a valuable tool for traders. However, it's crucial to combine this knowledge with sound risk management and a disciplined approach to trading. Remember, no pattern is foolproof, and the market can always surprise you. By staying informed and cautious, you can navigate these situations more effectively and make better trading decisions.


